
Straight Line Diagrams (SLDs), also known as Route Logs or Strip Maps, are an effective way to visualize different features and characteristics that co-exist along the same stretch of roadway. The traditional form of SLD is single-attribute and single-track; it depicts one attribute per layer in a single horizontal graphic. It assumes that there are no spatially overlapping segments in a layer. Figure 1 illustrates a traditional SLD displaying four layers: AADT, PCI, Travel Speed and Pavement Type.

Figure 1. Traditional SLD with single attribute for each layer, shown as single tracks
However, practitioners and LRS management software tools often adopt more flexible, and sometimes more efficient, LRS data modelling. Let’s take a look at three different LRS data modelling scenarios, each requiring a different SLD for visualization.
Multi-attribute SLD
In one common scenario, layers may contain more than one attribute depicting non-spatial features. As an example, the carriageway layer data presented in Table 1 includes columns for four different, but related, attributes to describe each carriageway segment (column headings highlighted yellow): Type, Avg. Width, Direction and No. of Lanes.
Table 1. Carriageway layer data on Arizona DOT’s State Route 202 Frontage Road

To effectively show layers like Carriageway on an SLD, it would be advantageous to use the multi-attribute SLD as illustrated in Figure 2.

Figure 2. Multi-attribute SLD showing three attributes of Carriageway layer in separate, horizontal tracks
Multi-row SLD
While the multi-attribute SLD addresses the single-attribute limitation of the traditional SLD, the multi-row SLD is designed to overcome the single-track constraint. Often times on a route segment, there may be events or assets that spatially overlap. For example, Table 2 contains a list of current and completed projects located completely or partially within a 20-mile stretch of Utah’s I-15.
Table 2. Utah DOT sample ePM projects located on or within I-15, MPs 300-320

To visualize this layer on an SLD, the multi-row SLD illustrated in Figure 3 would be a good choice.

Figure 3. Multi-row SLD with each project shown in its own track
Multi-track SLD
The multi-track SLD is a specific kind of multi-row SLD, in which a set of events in a layer is stratified by an attribute to denote event categories, or to denote the vertical or lateral position of events. A good example of this scenario is Kansas DOT’s pavement layer data, as shown in Table 3. For the 3-mile stretch of highway K-10 EB, each row represents the pavement status (material, width & depth, etc.) of a particular layer identified by the Layer_No attribute. In the table, the “set of events” representing each highway segment is identified by the presence (or absence) of shading.
Table 3. Kansas DOT pavement layer data on K-10, MPs 0-3

The multi-track SLD would automatically render each pavement layer on its own track, as shown in Figure 4.
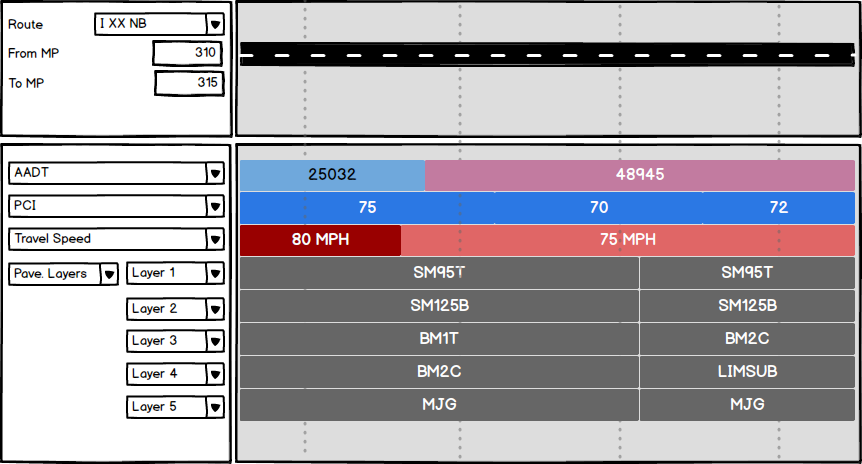
Figure 4. Multi-track SLD with each layer of pavement of a highway segment shown on its own track
Conclusion
At a time when on-line, interactive LRS visualization software is replacing static SLDs, these new SLD forms can become yet another tool in overcoming the challenges of visualizing LRS data.
Leave a Reply